Make sure you have mapnik installed. Depending on your installation path you may need to modify your PYTHONPATH, /etc/ld.so.conf or export LD_LIBRARY_PATH, or whatever your system requires.
The simple check is to start python interpreter from a command line by typing python and then just type:
>>> import mapnik
and if you don’t see any complaints, you’re on the right track. If you do, you have to check your installation again.
Note
If you have built mapnik in debug mode you should see the available datasources listed, including:
>>> import mapnik
registered datasource : gdal
registered datasource : postgis
registered datasource : raster
registered datasource : shape
Import the mapnik python toolkit and setup the basic map parameters
import mapnik

# Instantiate a map object with given width, height and spatial reference system
m = mapnik.Map(600,300,"+proj=latlong +datum=WGS84")
# Set background colour to 'steelblue'.
# You can use 'named' colours, #rrggbb, #rgb or rgb(r%,g%,b%) format
m.background = mapnik.Color('steelblue')
Note
Mapnik accepts any projection that Proj.4 handles. See http://spatialreference.org for the proj4 strings for various projections. For example http://spatialreference.org/ref/epsg/4326/mapnikpython/ will give you the exact parameters for EPSG 4326.
Create the Styles and Rules for the map symbology
# Now lets create a style and add it to the Map.
s = mapnik.Style()
# A Style can have one or more rules. A rule consists of a filter, min/max scale
# demoninators and 1..N Symbolizers. If you don't specify filter and scale denominators
# you get default values :
#   Filter =  'ALL' filter (meaning symbolizer(s) will be applied to all features)
#   MinScaleDenominator = 0
#   MaxScaleDenominator = INF
# Lets keep things simple and use default value, but to create a map we
# we still must provide at least one Symbolizer. Here we  want to fill countries polygons with
# greyish colour and draw outlines with a bit darker stroke.

r=mapnik.Rule()
r.symbols.append(mapnik.PolygonSymbolizer(mapnik.Color('#f2eff9')))
r.symbols.append(mapnik.LineSymbolizer(mapnik.Color('rgb(50%,50%,50%)'),0.1))
s.rules.append(r)
Connect the style information to your map and your data
# Here we have to add our style to the Map, giving it a name.
m.append_style('My Style',s)

# Here we instantiate our data layer, first by giving it a name and srs (proj4 projections string), and then by giving it a datasource.
lyr = mapnik.Layer('world',"+proj=latlong +datum=WGS84")
# Then provide the full filesystem path to a shapefile in WGS84 or EPSG 4326 projection without the .shp extension
# A sample shapefile can be downloaded from http://mapnik-utils.googlecode.com/svn/data/world_borders.zip
lyr.datasource = mapnik.Shapefile(file='/Users/path/to/your/data/world_borders')
lyr.styles.append('My Style')
Finally add the layers to the map and zoom to the full extent of the data layer
m.layers.append(lyr)
m.zoom_to_box(lyr.envelope())
Finish up by making the world map image
# Write the data to a png image called world.png in the base directory of your user
mapnik.render_to_file(m,'world.png', 'png')

# Exit the python interpreter
exit()
Then back in your normal shell type:
# On a mac
open world.png
# On windows
start world.png
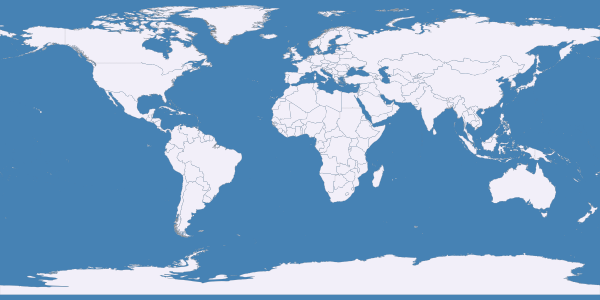
Or navigate to your base directory and open world.png and the result should look like this:
The next logical step is to run the same code as a python script from your shell/terminal. This way you will be able to modify and experiment with the settings.
This can be done by adding a line at the top of the script like:
#!/usr/bin/env python
Copy this entire text below and save as a file called world.py.
#!/usr/bin/env python

import mapnik
m = mapnik.Map(600,300,"+proj=latlong +datum=WGS84")
m.background = mapnik.Color('steelblue')
s = mapnik.Style()
r=mapnik.Rule()
r.symbols.append(mapnik.PolygonSymbolizer(mapnik.Color('#f2eff9')))
r.symbols.append(mapnik.LineSymbolizer(mapnik.Color('rgb(50%,50%,50%)'),0.1))
s.rules.append(r)
m.append_style('My Style',s)
lyr = mapnik.Layer('world',"+proj=latlong +datum=WGS84")
lyr.datasource = mapnik.Shapefile(file='/Users/path/to/your/data/world_borders')
lyr.styles.append('My Style')
m.layers.append(lyr)
m.zoom_to_box(lyr.envelope())
mapnik.render_to_file(m,'world.png', 'png')
Note
Don’t forget to change the path to your world_borders shapefile.
Next make the script executable. On Mac or Linux you would do this with the command:
chmod +x world.py
Finally run the script with the command:
# You must be in the same directory as you saved the script
./world.py
# Add a second optional command to open the resulting file with one keystroke
# On a mac
./world.py; open world.png
# On windows
start world.py && start world.png
To view the XML approach to make this same map head over to XMLGettingStarted XmlGettingStarted / Tutorial 2 which shows the use of XML map configurations.
To download this script along with other tutorial scripts see: http://code.google.com/p/mapnik-utils/
Atached file world.png.