Make sure you have mapnik installed and you’ve successfully run through GettingStarted Tutorial 1.
Two examples will be shown:
1) An XML configuration that exactly matches the map output from the pure python example in The Getting Started Tutorial 1.
2) An XML configuration that uses a world borders dataset with population attributes to create a chloropleth map by population size. This is intended to introduce the uses of rule filters and labeling in XML
Note: the code for example 1, along with the code from GettingStarted Tutorial 1 can be downloaded in a zip bundle from a link below. These downloads contain relative paths to a data folder where you should place the world_borders.shp.
Hello World XML
First you will still need a python script that sets the basic map parameters and points to the XML config file:
#!/usr/bin/env python
import mapnik mapfile = 'world_styles.xml'
map_output = 'hello_world_using_xml_config.png'
m = mapnik.Map(600, 300)
mapnik.load_map(m, mapfile)
bbox = mapnik.Envelope(mapnik.Coord(-180.0, -90.0), mapnik.Coord(180.0, 90.0))
m.zoom_to_box(bbox)
mapnik.render_to_file(m, map_output)
Next you will need to create the world_styles.xml file referenced in the world_map.py
Note: you will need to specify the path to the same Mapping Hacks world borders shapefile using in Tutorial 1
<?xml version="1.0" encoding="utf-8"?>
<!DOCTYPE Map>
<Map bgcolor="steelblue" srs="+proj=latlong +datum=WGS84">
  <Style name="My Style">
    <Rule>
      <PolygonSymbolizer>
        <CssParameter name="fill">#f2eff9</CssParameter>
      </PolygonSymbolizer>
      <LineSymbolizer>
        <CssParameter name="stroke">rgb(50%,50%,50%)</CssParameter>
        <CssParameter name="stroke-width">0.1</CssParameter>
      </LineSymbolizer>
    </Rule>
  </Style>
  <Layer name="world" srs="+proj=latlong +datum=WGS84">
    <StyleName>My
      Style</StyleName>
    <Datasource>
      <Parameter name="type">shape</Parameter>
      <Parameter name="file">/path/to/your/world_borders</Parameter>
    </Datasource>
  </Layer>
</Map>
Now run that script with this command:
python world_map.py
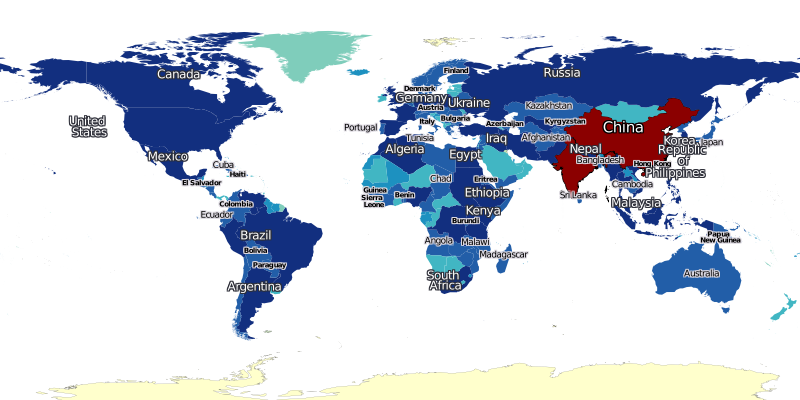
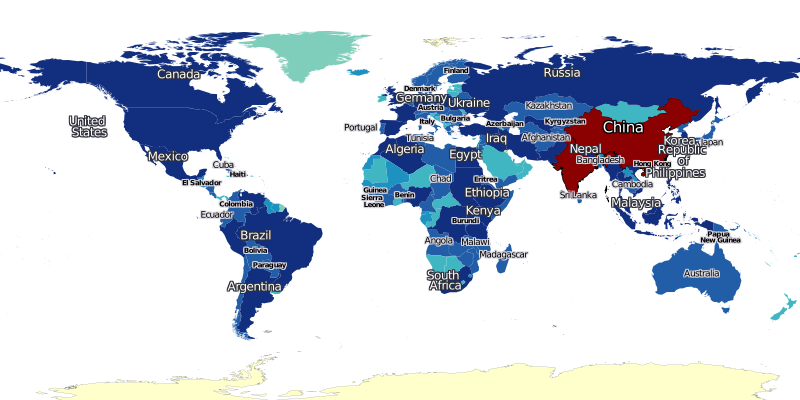
World Population XML
Attached below and included as code samples, here is a sample python script that accesses a population.xml map configuration.
Note: you will need to download the modified world borders shapefile.
This script should result in a graphic like this:
#!/usr/bin/env python

import mapnik mapfile = "population.xml"
m = mapnik.Map(1400, 600)
mapnik.load_map(m, mapfile)
bbox = mapnik.Envelope(mapnik.Coord(-180.0, -75.0), mapnik.Coord(180.0, 90.0))
m.zoom_to_box(bbox)
mapnik.render_to_file(m, 'world_population.png', 'png')
And here is the xml file:
<?xml version="1.0" encoding="utf-8"?>
<!DOCTYPE Map>
<!-- Sample Mapnik XML template by Dane Springmeyer -->
<Map bgcolor="white" srs="+proj=latlong +datum=WGS84">
<Style name="population">
<Rule>
<!-- Built from Seven Class sequential YIGnBu from www.colorbrewer.org -->
<!-- Quantile breaks originally from QGIS layer classification -->
<Filter>[POP2005] = 0 </Filter>
<PolygonSymbolizer>
<CssParameter name="fill">#ffffcc</CssParameter>
</PolygonSymbolizer>
<!-- Outlines for Antarctica look good -->
<LineSymbolizer>
<CssParameter name="stroke">black</CssParameter>
<CssParameter name="stroke-width">.1</CssParameter>
</LineSymbolizer>
</Rule>
<Rule>
<Filter>[POP2005] > 0 and [POP2005] < 15000</Filter>
<PolygonSymbolizer>
<CssParameter name="fill">#c7e9b4</CssParameter>
</PolygonSymbolizer>
<!-- Outlines for Antarctica look good -->
<LineSymbolizer>
<CssParameter name="stroke">black</CssParameter>
<CssParameter name="stroke-width">.1</CssParameter>
</LineSymbolizer>
</Rule>
<Rule>
<Filter>[POP2005] >= 15000 and [POP2005] < 255000</Filter>
<PolygonSymbolizer>
<CssParameter name="fill">#7fcdbb</CssParameter>
</PolygonSymbolizer>
</Rule>
<Rule>
<Filter>[POP2005] >= 255000 and [POP2005] < 1300000</Filter>
<PolygonSymbolizer>
<CssParameter name="fill">#1d91c0</CssParameter>
</PolygonSymbolizer>
</Rule>
<Rule>
<Filter>[POP2005] >= 1300000 and [POP2005] < 4320000</Filter>
<PolygonSymbolizer>
<CssParameter name="fill">#41b6c3</CssParameter>
</PolygonSymbolizer>
</Rule>
<Rule>
<Filter>[POP2005] >= 4320000 and [POP2005] < 9450000</Filter>
<PolygonSymbolizer>
<CssParameter name="fill">#225ea8</CssParameter>
</PolygonSymbolizer>
</Rule>
<Rule>
<Filter>[POP2005] >= 9450000 and [POP2005] < 25650000</Filter>
<PolygonSymbolizer>
<CssParameter name="fill">#225ea8</CssParameter>
</PolygonSymbolizer>
</Rule>
<Rule>
<Filter>[POP2005] >= 25650000 and [POP2005] < 1134000000</Filter>
<PolygonSymbolizer>
<CssParameter name="fill">#122F7F</CssParameter>
</PolygonSymbolizer>
</Rule>
<Rule>
<ElseFilter/>
<!-- This will catch all other values - in this case just India and China -->
<!-- A dark red polygon fill and black outline is used here to highlight these two countries -->
<PolygonSymbolizer>
<CssParameter name="fill">darkred</CssParameter>
</PolygonSymbolizer>
<LineSymbolizer>
<CssParameter name="stroke">black</CssParameter>
<CssParameter name="stroke-width">.7</CssParameter>
</LineSymbolizer>
</Rule>
</Style>
<Style name="countries_label">
<Rule>
<!-- Only label those countries with over 9 Million People -->
<!-- Note: Halo and Fill are reversed to try to make them subtle -->
<Filter>[POP2005] >= 4320000 and [POP2005] < 9450000</Filter>
<TextSymbolizer name="NAME" face_name="DejaVu Sans Bold" size="7" fill="black" halo_fill="#DFDBE3" halo_radius="1" wrap_width="20" spacing="5" allow_overlap="false" avoid_edges="false" min_distance="10"/>
</Rule>
<Rule>
<!-- Only label those countries with over 9 Million People -->
<!-- Note: Halo and Fill are reversed to try to make them subtle -->
<Filter>[POP2005] >= 9450000 and [POP2005] < 25650000</Filter>
<TextSymbolizer name="NAME" face_name="DejaVu Sans Book" size="9" fill="black" halo_fill="#DFDBE3" halo_radius="1" wrap_width="20" spacing="5" allow_overlap="false" avoid_edges="false" min_distance="10"/>
</Rule>
<Rule>
<!-- Those with over 25 Million get larger labels -->
<Filter>[POP2005] >= 25650000 and [POP2005] < 1134000000</Filter>
<TextSymbolizer name="NAME" face_name="DejaVu Sans Book" size="12" fill="white" halo_fill="#2E2F39" halo_radius="1" wrap_width="20" spacing="5" allow_overlap="false" avoid_edges="true" min_distance="10"/>
</Rule>
<Rule>
<!-- Those with over 25 Million get larger labels -->
<!-- Note: allow_overlap is true here to allow India to sneak through -->
<Filter>[POP2005] >= 1134000000</Filter>
<TextSymbolizer name="NAME" face_name="DejaVu Sans Book" size="15" fill="white" halo_fill="black" halo_radius="1" wrap_width="20" spacing="5" allow_overlap="true" avoid_edges="true" min_distance="10"/>
</Rule>
</Style>
<Layer name="countries" srs="+proj=latlong +datum=WGS84" status="on">
<!-- Style order determines layering hierarchy -->
<!-- Labels go on top so they are listed second -->
<StyleName>population</StyleName>
<StyleName>countries_label</StyleName>
<Datasource>
<Parameter name="type">shape</Parameter>
<!-- FIXME -->
<!-- Note: 'TM_WORLD_BORDERS_SIMPL-0.3' is the name of the shapefile (without the .shp file extension) -->
<Parameter name="file">/PATH/TO/THE/TM_WORLD_BORDERS_SIMPL-0.3</Parameter>
</Datasource>
</Layer>
</Map>
Attached files
hello_world.zip - Tutorial for Hello World Mapnik examples using pure python and XML config file.
world_population.png Map graphic output of Step 2 using XML configuration to display chloropleth map of world population.
world_population_minimized.png - Minimized version of the output of Step 2 for trac display.